SQL Performance Analysis
Performance Monitor Tool
Performance Monitor tracks resource behavior by capturing performance data generated by hardware and software components of the system, such as a processor, a process, a thread, and so on.
To start Perfmon do the following :
- Click Start
- Type run
- Type perfmon
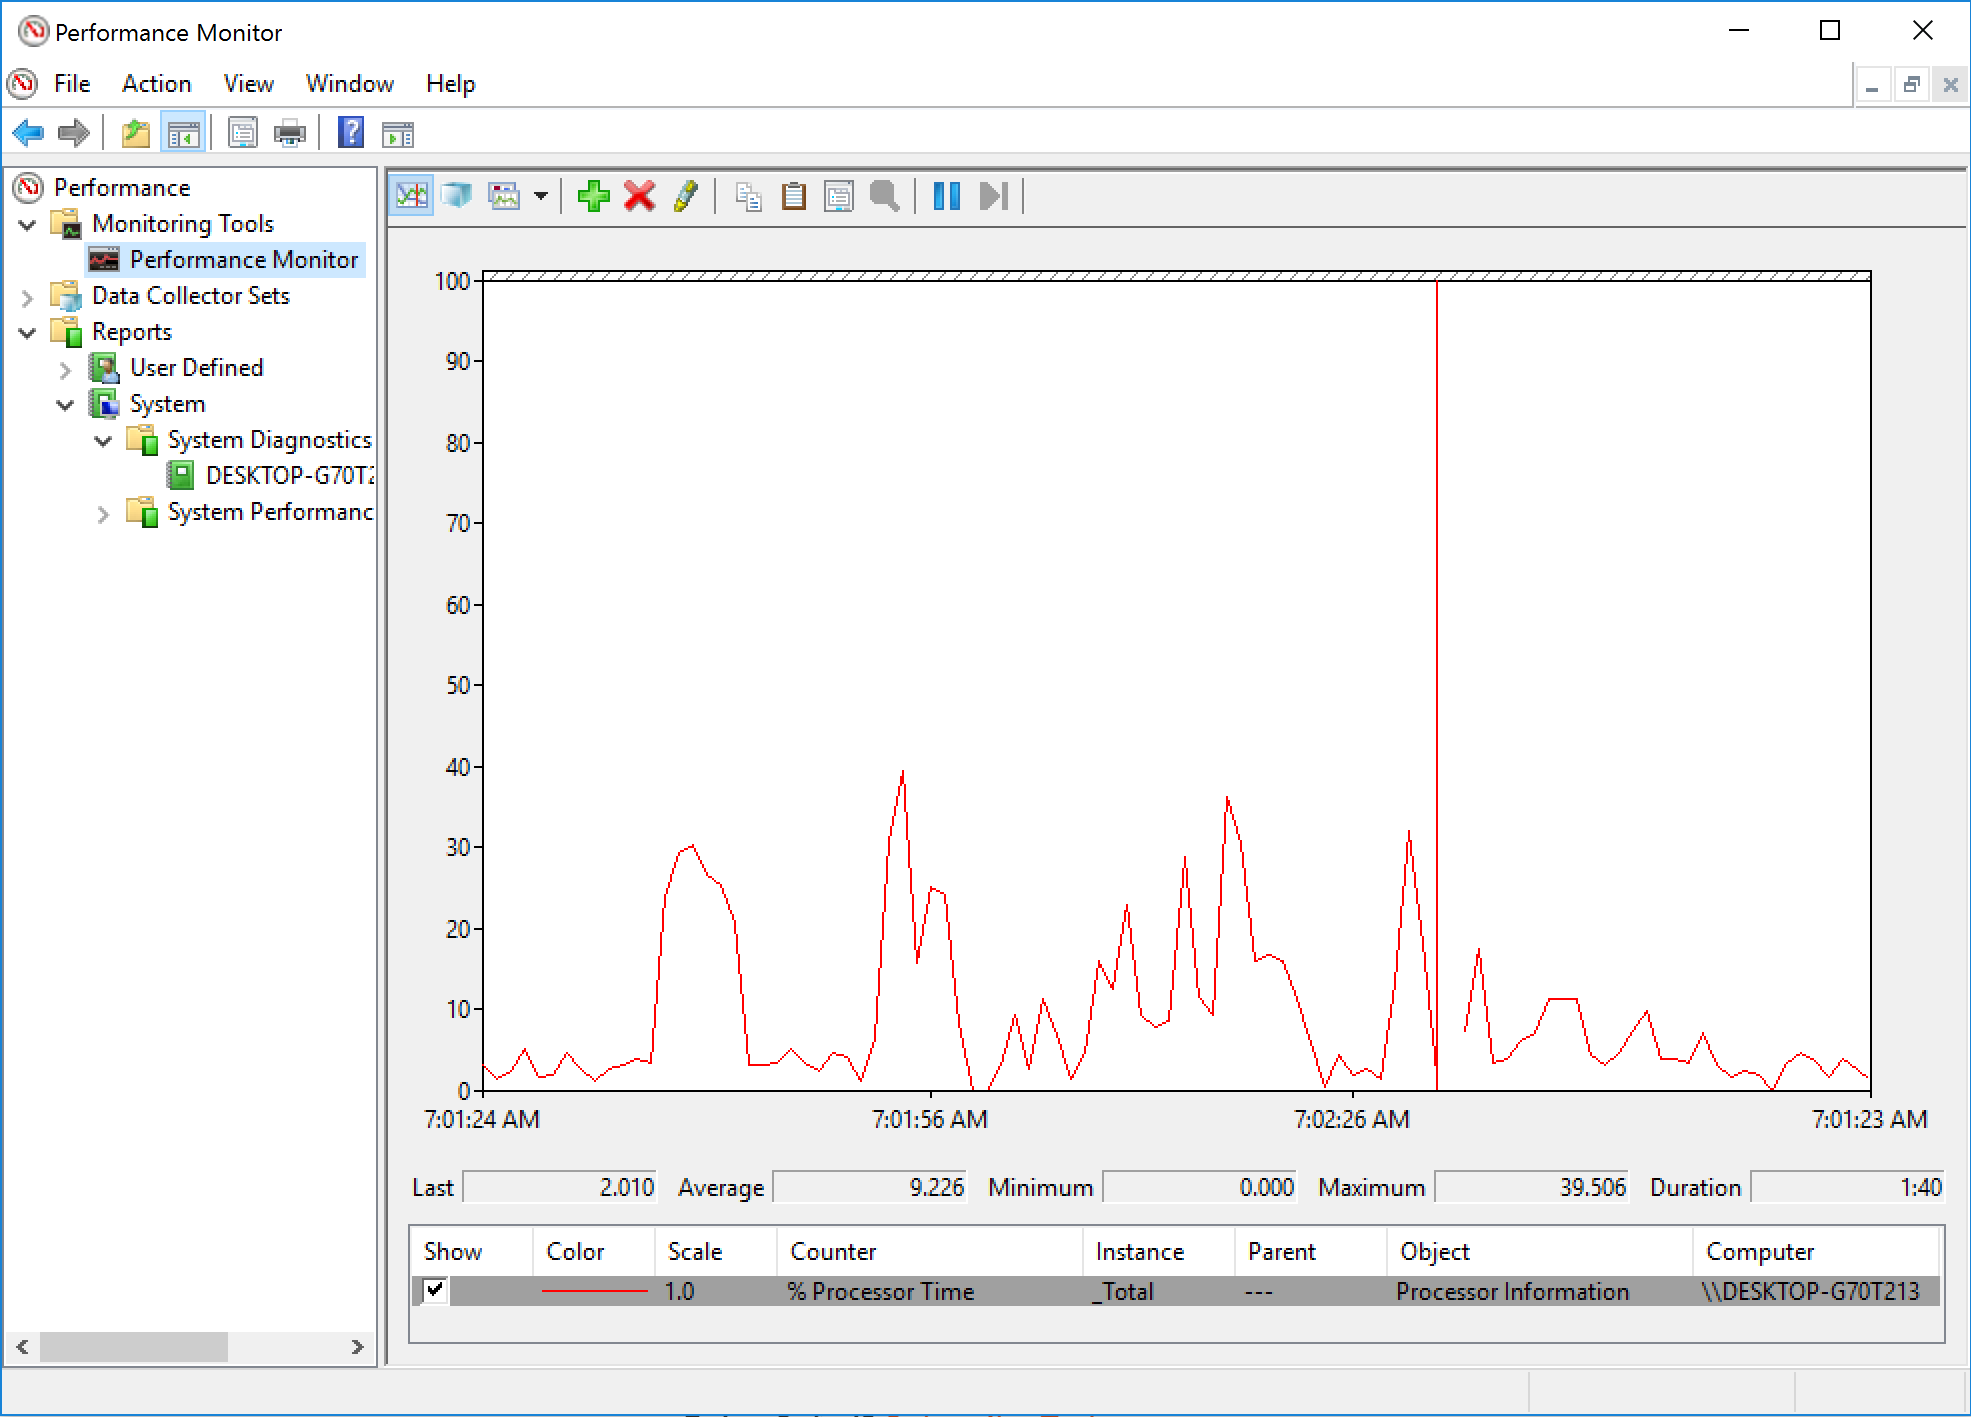
There can be multiple instances of a component and totals for all the components, e.g for the Processor component
- Performance object: Processor
- Counter: % Processor Time
- Instance: _Total
You can use the graphical component to gather counters but the recommended way is to save the data collection set to a file and analyze off the production server.
Dynamic Management Views
Dynamic management views and functions return server state information that can be used to monitor the health of a server instance, diagnose problems, and tune performance.
There are two types of dynamic management views and functions:
- Server-scoped dynamic management views and functions -These require VIEW SERVER STATE permission on the server.
- Database-scoped dynamic management views and functions - These require VIEW DATABASE STATE permission on the database.
All dynamic management views and functions exist in the sys schema and follow this naming convention sys.dm_.
Here are some execution dynamic management functions and views we will use in this guide :
Execution Related DMVs
- sys.dm_exec_query_plan
- sys.dm_exec_query_stats
- sys.dm_exec_sql_text
- sys.dm_exec_cached_plans
- sys.dm_exec_procedure_stats
- sys.dm_exec_query_optimizer_info
- sys.dm_exec_requests
- sys.dm_exec_text_query_plan
I/O Related DMVs
- sys.dm_io_virtual_file_stats
- sys.dm_io_pending_io_requests
Transaction Related DMVs
- sys.dm_tran_database_transaction
- sys.dm_tran_session_transactions
- sys.dm_tran_active_transactions
- sys.dm_tran_current_transaction
- sys.dm_tran_locks
SQL Server Operating System Related Dynamic Management Views
- sys.dm_os_buffer_descriptors
- sys.dm_os_host_info
- sys.dm_os_memory_brokers
- sys.dm_os_memory_cache_counters
- sys.dm_os_memory_cache_entries
- sys.dm_os_memory_clerks
- sys.dm_os_memory_nodes
- sys.dm_os_performance_counters
- sys.dm_os_process_memory
- sys.dm_os_schedulers
- sys.dm_os_sys_info
- sys.dm_os_sys_memory
- sys.dm_os_tasks
- sys.dm_os_threads
- sys.dm_os_volume_stats
- sys.dm_os_wait_stats
- sys.dm_os_waiting_tasks
- sys.dm_os_windows_info
- sys.dm_os_workers
Object Related Dynamic Management Views and Functions
- sys.dm_db_stats_properties
- sys.dm_db_stats_histogram
sys.dm_exec_requests and sys.dm_exec_sessions
sys.dm_exec_requestsDMV is used to show resources currently used by an executing requestsys.dm_exec_sessionsshows the accumulated resources used on a session.
To see the difference between the two DMVs let run the following :
 -- copy and be ready to run the following code on that window:
DBCC FREEPROCCACHE
DBCC DROPCLEANBUFFERS
GO
SELECT * FROM Production.Product p1 CROSS JOIN
Production.Product p2
and in a new query window run the following and replace the SPID :
-- copy the following code to a second window
SELECT cpu_time, reads, total_elapsed_time, logical_reads, row_count
FROM sys.dm_exec_requests
WHERE session_id = 56
GO
SELECT cpu_time, reads, total_elapsed_time, logical_reads, row_count
FROM sys.dm_exec_sessions
WHERE session_id = 56
sys.dm_exec_query_stats
Provides aggregated performance information for cached query plans. Using this information, you can avoid running server trace since the same information is available using this DMV.
Let’s see how the DMV works by running the following queries :
-- create the following stored procedure with three simple queries:
CREATE PROC test
AS
SELECT * FROM Sales.SalesOrderDetail WHERE SalesOrderID = 60677
SELECT * FROM Person.Address WHERE AddressID = 21
SELECT * FROM HumanResources.Employee WHERE BusinessEntityID = 229
Clean the buffer pool and the procedure cache and execute the stored procedure and notice the results from the DMV using the following :
-- note that the code uses the sys.dm_exec_sql_text DMF
DBCC FREEPROCCACHE
DBCC DROPCLEANBUFFERS
GO
EXEC test
GO
SELECT execution_count, total_worker_time, total_physical_reads, total_logical_reads, text, sql_handle, plan_handle
FROM sys.dm_exec_query_stats
CROSS APPLY sys.dm_exec_sql_text(sql_handle)
WHERE objectid = OBJECT_ID('dbo.test')
If you run several times you will notice the execution count value going up if the cached query plan is reused. The batch have the same sql_handle and query_handle and we can use those to retrieve the sql text within the batch and the query plan.
Cached Plans
The DMV only displays the resource usage information for cached query plans. Due to memory pressure some query plans will not be cached, so you should be careful of missing expensive queries that might be running on the server but do not have their query plans cached. Instead you can use the sys.dm_exec_query_requests to currently executing queries.
Retrieving the Actual Query with the Batch
Using the statement_start_offset and statement_end_offset we can retrieve the actual query within the batch. Both columns are the number of bytes where the query text begins and ends. Zero is the start of the batch and -1 the end of the batch.
The text data is stored as Unicode so we need to divide by 2 to get the length of the actual strings. We can use the SUBSTRING and DATALENGTH functions to get the desired result as follows :
-- we can easily extend our previous query to inspect the plan cache to use statement_start_offset
-- and statement_end_offset and get something like the following code:
DBCC FREEPROCCACHE
DBCC DROPCLEANBUFFERS
GO
EXEC test
GO
SELECT SUBSTRING(text, (statement_start_offset/2) + 1,
((CASE statement_end_offset
WHEN -1
THEN DATALENGTH(text)
ELSE
statement_end_offset
END
- statement_start_offset)/2) + 1) AS statement_text, *
FROM sys.dm_exec_query_stats
CROSS APPLY sys.dm_exec_sql_text(sql_handle)
WHERE objectid = OBJECT_ID('dbo.test')
and we can manually test this be replacing the actual values as follows :
-- to test the concept for a particular query
SELECT SUBSTRING(text, 44 / 2 + 1, (168 - 44) / 2 + 1) FROM sys.dm_exec_sql_text(
0x03000500996DB224E0B27201B7A1000001000000000000000000000000000000000000000000000000000000)
Retrieving the sql text and plan with sql_handle and plan_handle
We can use the sql_handle and plan_handle to retrieve the sql text and plans respectively as follows :
– using the example before SELECT * from sys.dm_exec_sql_text( 0x03000500996DB224E0B27201B7A1000001000000000000000000000000000000000000000000000000000000)
The sql_handle hash is guaranteed to be unique for every batch in the system. The text of the batch is stored in the SQL Manager Cache or SQLMGR, which you can inspect by running the following query:
SELECT * FROM sys.dm_os_memory_objects WHERE type = ‘MEMOBJ_SQLMGR’
Because a sql_handle has a 1:N relationship with a plan_handle (that is, there can be more than one generated executed plan for a particular query), the text of the batch will remain on the SQLMGR cache store until the last of the generated plans is evicted from the plan cache.
The plan_handle is guaranteed to be unique for each batch in the system and we can retrieve the query plan as follows :
-- here is an example:
SELECT * FROM sys.dm_exec_query_plan(
0x05000500996DB224B0C9B8F80100000001000000000000000000000000000000000000000000000000000000)
Cached execution plans are stored in the SQLCP and OBJCP cache stores: object plans, including stored procedures, triggers, and functions, are stored in the OBJCP cache stores, whereas plans for ad hoc, autoparameterized, and prepared queries are stored in the SQLCP cache store.
Finding similar query plans and text with query_hash and plan_hash
When a query is auto-parameterised, the query plan and hash will be the same even if different plans are generated for the query. But this is not always the case, let’s look at an example :
DBCC FREEPROCCACHE
DBCC DROPCLEANBUFFERS
GO
SELECT * FROM Person.Address
WHERE AddressID = 12
GO
SELECT * FROM Person.Address
WHERE AddressID = 37
GO
SELECT plan_handle, plan_generation_num, execution_count FROM sys.dm_exec_query_stats
and the result shows the following :

You will notice both queries have the same plan handle and the plan was re-used to execute the second query. The query hashes are different but the plan handle are the same. The optimizer parameterised the query. This is good since the same query plan doesnt need to be re-generated again.
Now lets run and different query and use a different column as follows :
- however, we can see a different behavior with the following query:
DBCC FREEPROCCACHE
DBCC DROPCLEANBUFFERS
GO
SELECT * FROM Person.Address
WHERE StateProvinceID = 79
GO
SELECT * FROM Person.Address
WHERE StateProvinceID = 59
GO
SELECT * FROM sys.dm_exec_query_stats
Now notice this time that the plan handle is different since the optimizer generated separated query plans. The reason is because the StateProvinceID could return 0 , 1 or more rows and its not safe to parameterize them.
To aggregate the query and plan handle qe can use the query_hash and query_plan_hash values as they will be the same. the query_hash is computed from the tree of logical operators, so the text does not have to be exactly the same. Different queries will produce the same query_hash.
Finding Expensive Queries
Lets use the sys.dm_exec_query_stats to find expensive queries with cached plans. The query uses the query_hash to group all related queries regardless of whether they are parameterized or not as follows :
-- note that the query is grouping on the query_hash value to aggregate similar queries
SELECT TOP 20 query_stats.query_hash,
SUM(query_stats.total_worker_time) / SUM(query_stats.execution_count)
AS avg_cpu_time,
MIN(query_stats.statement_text) AS statement_text
FROM
(SELECT qs.*,
SUBSTRING(st.text, (qs.statement_start_offset/2) + 1,
((CASE statement_end_offset
WHEN -1 THEN DATALENGTH(ST.text)
ELSE qs.statement_end_offset END
- qs.statement_start_offset)/2) + 1) AS statement_text
FROM sys.dm_exec_query_stats qs
CROSS APPLY sys.dm_exec_sql_text(qs.sql_handle) AS st) AS query_stats
GROUP BY query_stats.query_hash
ORDER BY avg_cpu_time DESC
We can trim the query down and only focus on the query plans and the batch as follows :
-- notice that there is no need to use the statement_start_offset and statement_end_offset columns
-- to separate the particular queries and that this time we are grouping on the query_plan_hash value.
SELECT TOP 20 query_plan_hash,
SUM(total_worker_time) / SUM(execution_count) AS avg_cpu_time,
MIN(plan_handle) AS plan_handle, MIN(text) AS query_text
FROM sys.dm_exec_query_stats qs
CROSS APPLY sys.dm_exec_sql_text(qs.plan_handle) AS st
GROUP BY query_plan_hash
ORDER BY avg_cpu_time DESC
and we can find the most expensive queries currently executing as follows :
-- finally, we could also apply the same concept to find the most expensive queries currently executing
SELECT TOP 20 SUBSTRING(st.text, (er.statement_start_offset/2) + 1,
((CASE statement_end_offset
WHEN -1
THEN DATALENGTH(st.text)
ELSE
er.statement_end_offset
END
- er.statement_start_offset)/2) + 1) AS statement_text
, *
FROM sys.dm_exec_requests er
CROSS APPLY sys.dm_exec_sql_text(er.sql_handle) st
ORDER BY total_elapsed_time DESC
Hardware Resource Bottlenecks
Typically, SQL Server database performance is affected by stress on the following hardware resources:
- Memory
- Disk I/O
- Processor
- Network
Stress beyond the capacity of a hardware resource forms a bottleneck. To address the overall performance of a system, you need to identify these bottlenecks because they form the limit on overall system performance.
Memory Bottleneck Analysis
Memory can be a problematic bottleneck because a bottleneck in memory will manifest on other resources, too. When the SQL Server process is low on memory, the lazy writer process works extensively by writing pages from memory to disk causing high contention on I/O and also increasing CPU cycles.
SQL Server Memory Management
The biggest consumer of SQL Server memory is the buffer pool. SQL Server first reads the data from the physical file into the buffer pool. When there’s limited physical memory the pages from the buffer pool are flushed to dish.
The default SQL Server configuration is to dynamically manage memory. SQL Server will use the amount it needs and occasionally release memory to the OS.
We can configure the memory using SQL Server Management Studio :
- Right-Click the Server node in SQL Server Management Studio
- Click Properties
- Choose the Memory Tab
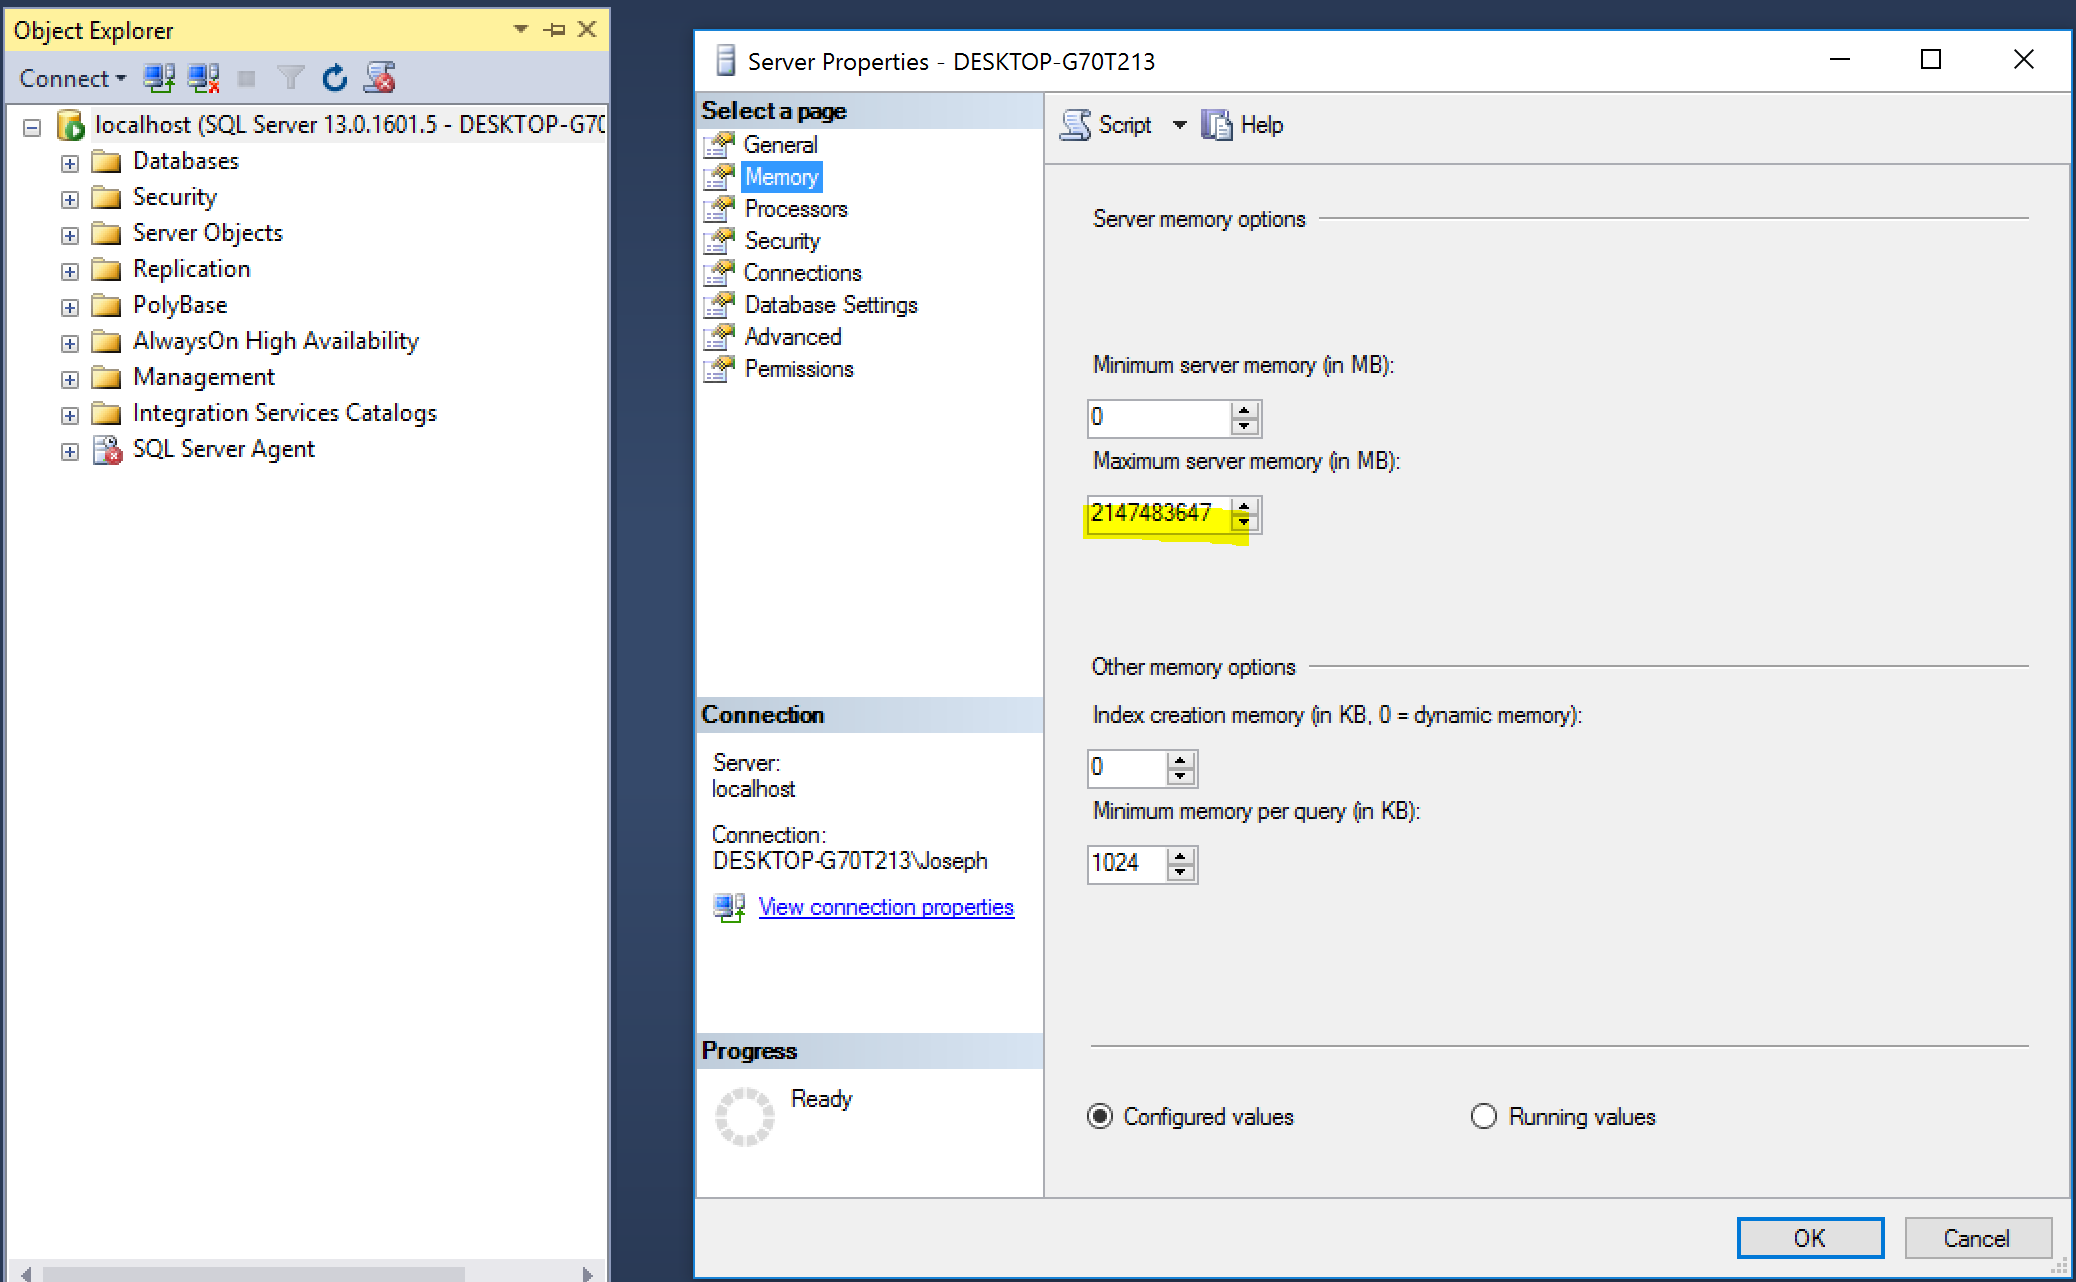
We can also use the sys.configurations to show the configured values for the minimum and maximum amount of memory as follows :
SELECT name, value, minimum, maximum, value_in_use, description, is_dynamic
FROM sys.configurations
WHERE name IN ('max server memory (MB)','min server memory (MB)')
or we can use the sp_configure stored procedure as follows :
--Enable showing advanced options
EXEC sp_configure 'show advanced options', 1;
GO
--Activate the new configuration
RECONFIGURE;
GO
EXEC sp_configure  'min server memory';
EXEC sp_configure  'max server memory';
We can also change the values using sp_configure but this is not recommended, e.g. to set the maximum memory to 10Gig and min server memory to 5Gig as follows :
USE master;
EXEC sp_configure  'show advanced option',   1;
RECONFIGURE;
exec sp_configure  'min server memory (MB)',  5120;
exec sp_configure  'max server memory (MB)',  10240;
RECONFIGURE WITH OVERRIDE;
Performance Monitor Counters for Memory Pressure
Here are Performance Monitors counters to monitor to detect memory pressure :
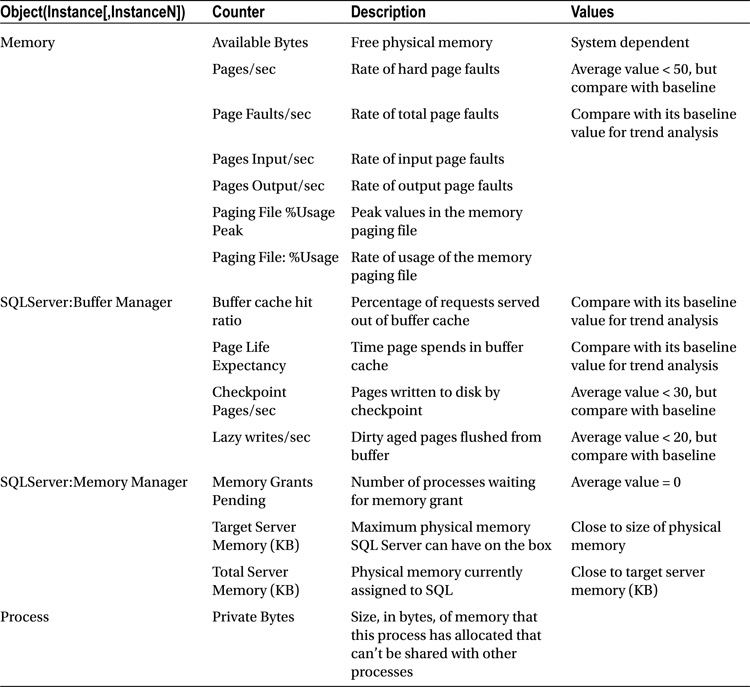
Buffer Cache Hit Ratio
This number of pages served from the buffer pool without having to read the data from the physical file. This value should be very high, in the 99 range for OLTP systems.
Page Life Expectancy
This counter determines how long a page will stay in the buffer pool. On NUMA systems, the counter value is an average. To see specific measures, you’ll need to use the Buffer Node:Page Life Expectancy counter.
Checkpoint Pages/Sec
The number of pages written to disk during checkpoint. This value should be very low around 30 and below.
Lazy Writes/Sec
The lazy writer process writes buffer pages to the disk, this values represent the number of pages written per second. The value should be consistently less than 20.
Monitoring Memory DMVs
The following DMVs can be used to monitor memory pressure with SQL Server :
- sys.dm_os_memory_brokers - Allocations that are internal to SQL Server use the SQL Server memory manager. Tracking the difference between process memory counters from sys.dm_os_process_memory and internal counters can indicate memory use from external components in the SQL Server memory space.
- sys.dm_os_memory_clerks - Returns the set of all memory clerks that are currently active in the instance of SQL Server.
Note
The SQL Server memory manager consists of a three-layer hierarchy. At the bottom of the hierarchy are memory nodes. The middle level consists of memory clerks, memory caches, and memory pools. The top layer consists of memory objects. These objects are generally used to allocate memory in an instance of SQL Server.
Memory nodes provide the interface and the implementation for low-level allocators. Inside SQL Server, only memory clerks have access to memory nodes. Memory clerks access memory node interfaces to allocate memory. Memory nodes also track the memory allocated by using the clerk for diagnostics. Every component that allocates a significant amount of memory must create its own memory clerk and allocate all its memory by using the clerk interfaces. Frequently, components create their corresponding clerks at the time SQL Server is started.
Memory Bottleneck Resolutions
A few of the common resolutions for memory bottlenecks are as follows:
- Optimizing application workload
- Allocating more memory to SQL Server
- Moving in-memory tables back to standard storage
- Increasing system memory
- Changing from a 32-bit to a 64-bit processor
- Enabling 3GB of process space
- Compressing data
- Addressing fragmentation
Disk Bottleneck Analysis
The disk subsystem is the slowest component within when troubleshooting SQL Server performance.
The optimal number of files depends on workload and the underlying hardware. As a rule of thumb, create four data files if the server has up to 16 logical CPUs, keeping a 1/8th ratio between files and CPUs afterward.
File Auto-growth
Set the same initial size and auto-growth parameters, with grow size being defined in megabytes rather than by percentage for all files in a same filegroup. This helps the proportional fill algorithm balance write activities evenly across data files.
SQL Server 2016 introduces two options— AUTOGROW_SINGLE_FILE and AUTOGROW_ALL_FILES—which control auto-growth events on a per-filegroup level. With AUTOGROW_SINGLE_FILE, which is the default option, SQL Server 2016 grows the single file in the filegroup when needed. With AUTOGROW_ALL_FILES, SQL Server grows all files in the filegroup whenever one of the files is out of space.
Enable Instant File Initialization
SQL Server doesn’t have a setting or checkbox to enable IFI.
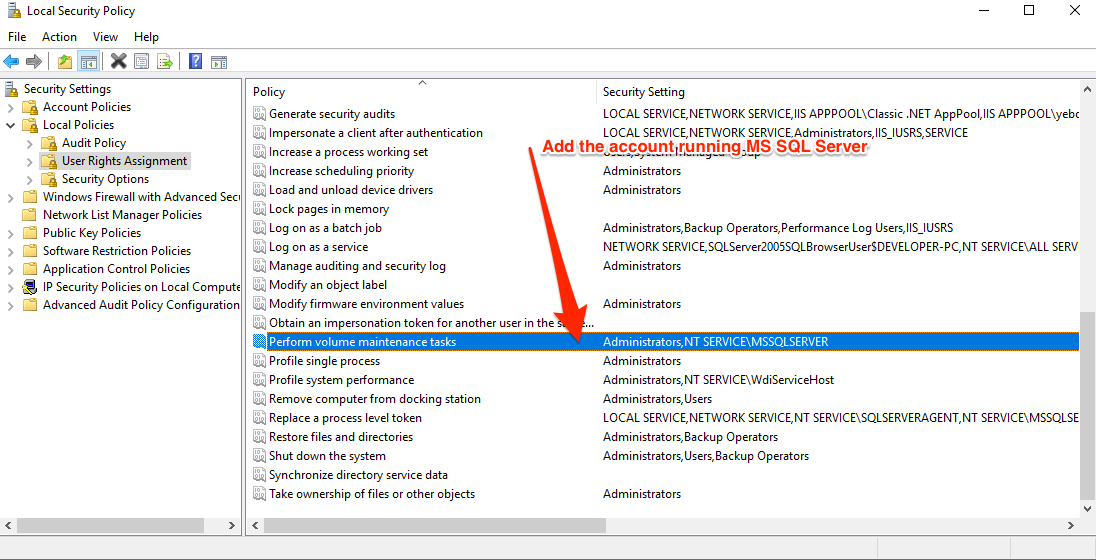
Instead, it detects whether or not the service account it’s running under has the Perform Volume Maintenance Tasks permission in the Windows Security Policy. You can find and edit this policy by running secpol.msc (Local Security Policy) in Windows. Then:
- Expand the Local Policies Folder
- Click on User Rights Assignment
- Go down to the “Perform Volume Maintenance Tasks” option and double click it
- Add your SQL Server Service account, and click OK out of the dialog.
IFI setting can also be enabled during the installation of SQL Server by checking the following :
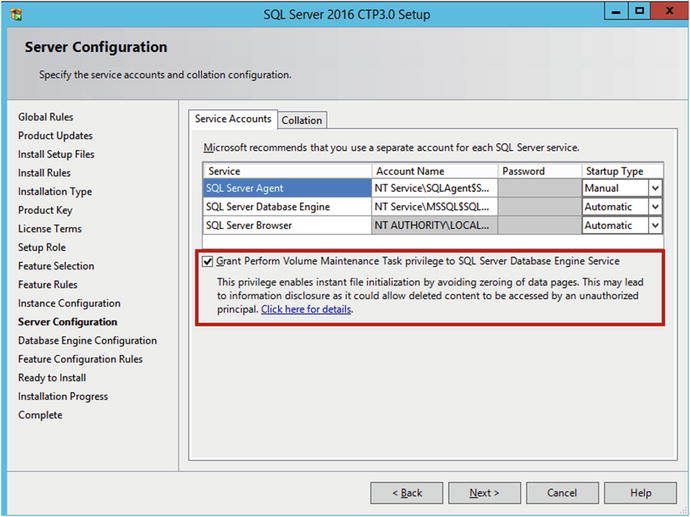
Restart SQL After Giving Permission
SQL Server checks to see if Instant File Initialization is enabled on startup. You need to restart the SQL Server service after you give the corresponding permission to the SQL Server startup account.
In order to check if Instant File Initialization is enabled, you can use the code below :
dbcc traceon(3004,3605,-1)
go
create database Dummy
go
exec sp_readerrorlog
go
drop database Dummy
go
dbcc traceoff(3004,3605,-1)
go
This code sets two trace flags that force SQL Server to put additional information into the error log, create a small database, and read the content of the error log file. If Instant File Initialization is not enabled, SQL Server will zero out both the .mdf file and .mdf files.
Data Pages and Data Rows
The space in the database is divided into logical 8KB pages. These pages are continuously numbered starting with zero, and they can be referenced by specifying a file ID and page number.
SQL Server does not let you create the table when this is not the case. For example, the code in Listing 1-8 produces an error.
create table dbo.BadTable
(
    Col1 char(4000),
    Col2 char(4060)
)
You can reduce the size of the data row by creating tables in a manner in which variable-length columns, which usually store null values, are defined as the last ones in the CREATE TABLE statement. This is the only case in which the order of columns in the CREATE TABLE statement matters.
Large Objects Storage
Even though the fixed-length data and the internal attributes of a row must fit into a single page, SQL Server can store the variable-length data on different data pages. There are two different ways to store the data, depending on the data type and length.
- ROW-OVERFLOW STORAGE
- LOB STORAGE
ROW-OVERFLOW STORAGE
SQL Server stores variable-length column data that does not exceed 8,000 bytes on special pages called row-overflow pages.
create table dbo.RowOverflow
(
    ID int not null,
    Col1 varchar(8000) null,
    Col2 varchar(8000) null
);
insert into dbo.RowOverflow(ID, Col1, Col2) values (1,replicate('a',8000),replicate('b',8000));
As you see, SQL Server creates the table and inserts the data row without any errors, even though the data-row size exceeds 8,060 bytes. The data is store in the row-overflow pages.
LOB STORAGE
For the text, ntext, or image columns, SQL Server stores the data off-row by default. It uses another kind of pages called a LOB data pages.
You can control this behavior to a degree by using the text in row table option. For example,
exec sp_table_option dbo.MyTable, 'text in row', 200

As with row-overflow data, there is a pointer to another piece of information called the LOB root structure, which contains a set of the pointers to other data pages and rows. When LOB data is less than 32 KB and can fit into five data pages, the LOB root structure contains the pointers to the actual chunks of LOB data. Otherwise, the LOB tree starts to include additional intermediate levels of pointers, similar to the index B-Tree
Lets store some data :
create table dbo.TextData
(
    ID int not null,
    Col1 text null
);
insert into dbo.TextData(ID, Col1) values (1, replicate(convert(varchar(max),'a'),16000));
Deprecated Types
text, ntext, and image data types are deprecated, and they will be removed in future versions of SQL Server. Use varchar(max), nvarchar(max), and varbinary(max) columns instead.
When a page does not have enough free space to accommodate a row, SQL Server allocates a new page and places the row.
SELECT * and I/O
There are plenty of reasons why selecting all columns from a table with the SELECT * operator is not a good idea. It is recommended that you avoid such a pattern and instead explicitly specify the list of columns needed by the client application. This is especially important with row-overflow and LOB storage, when one row can have data stored in multiple data pages. SQL Server needs to read all of those pages, which can significantly decrease the performance of queries.
As an example, let’s assume that we have table dbo.Employees, with one column storing employee pictures. The following code creates the table and populates it with some data.
create table dbo.Employees
(
    EmployeeId int not null,
    Name varchar(128) not null,
    Picture varbinary(max) null
);

with N1(C) as (select 0 union all select 0) -- 2 rows
    ,N2(C) as (select 0 from N1 as T1 cross join N1 as T2) -- 4 rows
    ,N3(C) as (select 0 from N2 as T1 cross join N2 as T2) -- 16 rows
    ,N4(C) as (select 0 from N3 as T1 cross join N3 as T2) -- 256 rows
    ,N5(C) as (select 0 from N4 as T1 cross join N2 as T2) -- 1,024 rows
    ,IDs(ID)
    as (
        select row_number() over (order by (select null)) from N5
    )
insert into dbo.Employees(EmployeeId, Name, Picture)
select ID,
	'Employee ' + convert(varchar(5),ID),
	convert(varbinary(max),
	replicate(convert(varchar(max),'a'),120000))
from Ids;
Compare the output from the two queries :
SET STATISTICS IO ON;
SET STATISTICS TIME ON;
select * from dbo.Employees;
SET STATISTICS IO OFF;
SET STATISTICS TIME OFF;
and the output from the query :
(1024 row(s) affected)
Table 'Employees'. Scan count 1, logical reads 7, physical reads 0, read-ahead reads 0, lob logical reads 90888, lob physical reads 0, lob read-ahead reads 0.
 SQL Server Execution Times:
   CPU time = 125 ms,  elapsed time = 3098 ms.
Take note of the 90888 number of lob reads.
and the query without choosing all columns :
SET STATISTICS IO ON;
SET STATISTICS TIME ON;
select EmployeeId, Name from dbo.Employees;
SET STATISTICS IO OFF;
SET STATISTICS TIME OFF;
and the following output :
(1024 row(s) affected)
Table 'Employees'. Scan count 1, logical reads 7, physical reads 0, read-ahead reads 0, lob logical reads 0, lob physical reads 0, lob read-ahead reads 0.
 SQL Server Execution Times:
   CPU time = 0 ms,  elapsed time = 144 ms.
Extents and Allocation Map Pages
QL Server logically groups eight pages into 64 KB units called extents. There are two types of extents available:
- mixed extents store data that belongs to different objects
- uniform extents store the data for the same object.
By default, when a new object is created, SQL Server stores the first eight object pages in mixed extents. After that, all subsequent space allocation for that object is done with uniform extents.
SQL Server uses a special kind of pages, called allocation maps, to track extent and page usage in a file.
- GAM - Global Allocation Map
- SGAM - Shared Global Allocation Map
- IAM - Index Allocation Map
Data Modifications
SQL Server does not read or modify data rows directly on the disk. Every time you access data, SQL Server reads it into memory.
Initial state

Data modification - modifying data

Data modifiation - checkpoint

There is another SQL Server process called lazy writer that can save dirty pages on disk. As the opposite to checkpoint, which saves dirty data pages by keeping them in the buffer pool, lazy writer processes the least recently used data pages (SQL Server tracks buffer pool page usage internally), releasing them from memory. It releases both dirty and clean pages, saving dirty data pages on disk during the process. As you can guess, lazy writer runs in case of memory pressure or when SQL Server needs to bring more data pages to the buffer pool.
Disk Performance Counters
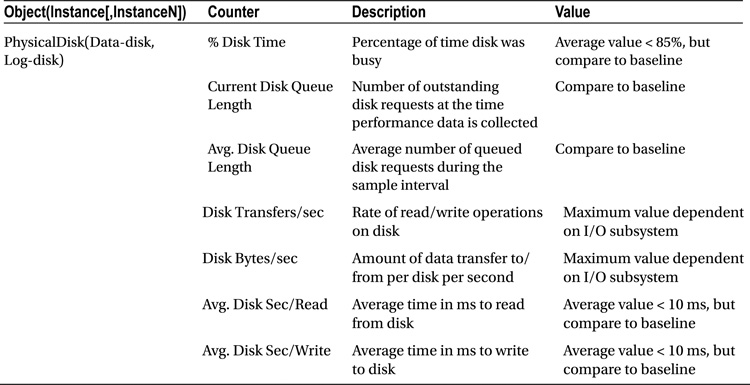
Disk Bottleneck Resolutions
A few of the common disk bottleneck resolutions are as follows:
- Optimizing application workload
- Using a faster I/O path
- Using a RAID array
- Using a SAN system
- Using Solid State Drives
- Aligning disks properly
- Using a battery-backed controller cache
- Adding system memory
- Creating multiple files and filegroups
- Moving the log files to a separate physical drive
- Using partitioned tables
Processor Bottleneck Analysis
Performance Monitor CPU Counters
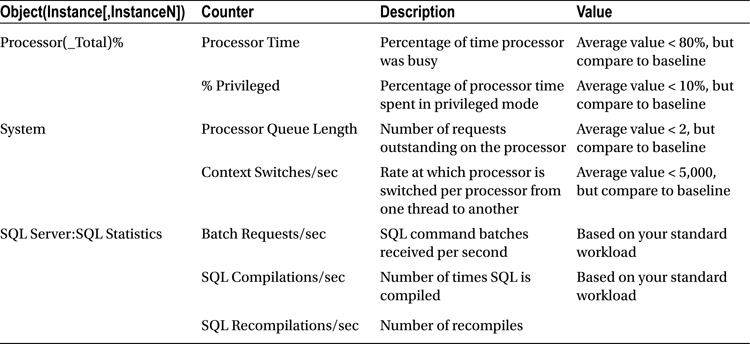
Processor Bottleneck Resolutions
You can use the following DMVs to monitor CPU pressure :
- sys.dm_os_workers
- sys.dm_os_schedulers
A few of the common processor bottleneck resolutions are as follows:
- Optimizing application workload
- Eliminating or reducing excessive compiles/recompiles
- Using more or faster processors
- Not running unnecessary software
Network Bottleneck Analysis
There are few issues related to networking issues on a production server but you should pay attention and monitor the performance of your network.

Network Bottleneck Resolutions
A few of the common network bottleneck resolutions are as follows:
- Optimizing application workload
- Adding network adapters
- Moderating and avoiding interruptions
- Let’s consider these resolutions in more detail
SQL Server Overall Performance
To analyze the overall performance of a SQL Server instance, besides examining hardware resource utilization, you should also examine some general aspects of SQL Server itself. You can use the performance counters presented below :
| Object(Instance[,InstanceN]) | Counter |
|---|---|
| SQLServer:Access | Methods FreeSpace Scans/secFull Scans/secTable Lock Escalations/secWorktables Created/sec |
| SQLServer:Latches | Total Latch Wait Time (ms) |
| SQLServer:Locks(_Total) | Lock Timeouts/secLock Wait Time (ms)Number of Deadlocks/sec |
| SQLServer:SQL Statistics | Batch Requests/secSQL Re-Compilations/sec |
| SQLServer:General Statistics | Processes BlockedUser ConnectionsTemp Tables Creation RateTemp Tables for Destruction |
Creating a Baseline
You can use the following steps to create a baseline :
- Create a reusable list of performance counters.
- Create a counter log using your list of performance counters.
- Minimize Performance Monitor overhead.