SQL Query Performance Analysis
- Extended Events
- Benefits of SQL Server Extended Events
- Extended Events Concepts
- Extended Events Automation
- Testing the Session with Data
- Displaying Results
Extended Events
In this module we will cover using Extended Events. SQL Server Extended Events has a highly scalable and highly configurable architecture that allows users to collect as much or as little information as is necessary to troubleshoot or identify a performance problem.
Benefits of SQL Server Extended Events
Extended Events allows you to do the following:
- Graphically monitor SQL Server queries
- Collect query information in the background
- Analyze performance
- Diagnose problems such as deadlocks
- Debug a Transact-SQL (T-SQL) statement
- Extended Events is a light weight performance monitoring system that uses very few performance resources.
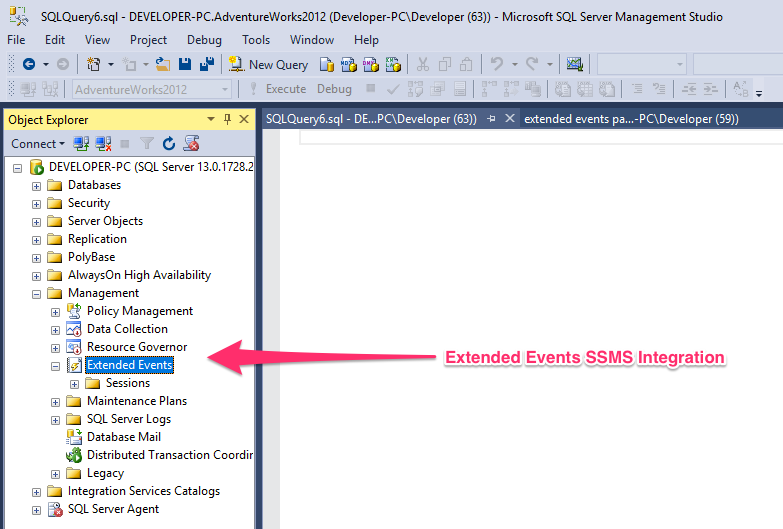
SQL Server Management Studio Extended Events Integration
SQL Server Management Studio provides an excellent user interface (UI) for extended events. The UI is so good that many users have no need to engage with extended events by using Transact-SQL or the dynamic management views (DMVs) that target extended events.
Extended Events Concepts
SQL Server Extended Events (Extended Events) builds on existing concepts, such as an event or an event consumer, uses concepts from Event Tracing for Windows(ETW), and introduces new concepts.
- Package
- Session
- Events
- Targets
- Predicates
Package
A package is a container for SQL Server Extended Events objects. There are three kinds of Extended Events packages, which include the following:
- package0 - Extended Events system objects. This is the default package.
- sqlserver - SQL Server related objects.
- sqlos - SQL Server Operating System (SQLOS) related objects.
Packages are identified by a name, a GUID, and the binary module that contains the package. We can use the sys.dm_xe_packages DMV to look at more information about packages. Here is an example listing the available packages and the dll file providing the module :
SELECT xe.name, xe.description, os.name
FROM sys.dm_xe_packages xe
JOIN sys.dm_os_loaded_modules os
ON xe.module_address = os.base_address
Package Contents
The following illustration shows the objects that can exist in packages, which are contained in a module. A module can be an executable or a dynamic link library.
Events
Events are monitoring points of interest in the execution path of a program, such as SQL Server. An event firing carries with it the fact that the point of interest was reached, and state information from the time the event was fired.
Events can be used solely for tracing purposes or for triggering actions. These actions can either be synchronous or asynchronous.
Note
An event does not have any knowledge of the actions that may be triggered in response to the event firing.
All events have a versioned schema which defines their contents. This schema is composed of event columns with well defined types. An event of a specific type must always provide its data in exactly the same order that is specified in the schema. However, an event target does not have to consume all the data that is provided.
We can query for available events using the following DMV, sys.dm_xe_objects as follows :
SELECT name, description
FROM sys.dm_xe_objects
WHERE object_type = 'event'
ORDER BY name
Event Categorization
Extended Events uses an event categorization model similar to Event Tracing for Windows (ETW). Two event properties are used for categorization, channel and keyword.
Channel
A channel identifies the audience for an event. These channels are described in the following table.
| Term | Definition |
|---|---|
| Admin | Admin events are primarily targeted to the end users, administrators, and support. The events that are found in the admin channels indicate a problem with a well-defined solution that an administrator can act on. An example of an admin event is when an application fails to connect to a printer. These events are either well-documented or have a message associated with them that tells the reader what to do to rectify the problem. |
| Operational | Operational events are used for analyzing and diagnosing a problem or occurrence. They can be used to trigger tools or tasks based on the problem or occurrence. An example of an operational event is when a printer is added or removed from a system. |
| Analytic | Analytic events are published in high volume. They describe program operation and are typically used in performance investigations. |
| Debug | Debug events are used solely by developers to diagnose a problem for debugging. |
Events in the Debug channel return internal implementation-specific state data. The schemas and data that the events return may change or become invalid in future versions of SQL Server. Therefore, events in the Debug channel may change or be removed in future versions of SQL Server without notice.
Keyword
A keyword is application specific and enables a finer-grained grouping of related events, which makes it easier for you to specify and retrieve an event that you want to use in a session. You can use the following query to obtain keyword information.
SELECT map_value Keyword
FROM sys.dm_xe_map_values
WHERE name = 'keyword_map'
Targets
SQL Server Extended Events targets are event consumers. Targets can write to a file, store event data in a memory buffer, or aggregate event data. Targets can process data synchronously or asynchronously.
Extended Events provide the following targets that you can use for an Extended Events session:
Event counter - Counts all specified events that occur during an Extended Events session. Use to obtain information about workload characteristics without adding the overhead of full event collection. This is a synchronous target.
Event file - Use to write event session output from complete memory buffers to disk. This is an asynchronous target.
Event pairing - Many kinds of events occur in pairs, such as lock acquires and lock releases. Use to determine when a specified paired event does not occur in a matched set. This is an asynchronous target.
Event Tracing for Windows (ETW) - Use to correlate SQL Server events with Windows operating system or application event data. This is a synchronous target.
Histogram - Use to count the number of times that a specified event occurs, based on a specified event column or action. This is an asynchronous target.
Ring buffer - Use to hold the event data in memory on a first-in first-out (FIFO) basis, or on a per-event FIFO basis. This is an asynchronous target.
Actions
An action is a programmatic response or series of responses to an event. Actions are bound to an event, and each event may have a unique set of actions. Actions can:
- Capture a stack dump and inspect data.
- Capture the query plan hash
- Capture the sql query hash
- Store state information in a local context using variable storage.
- Aggregate event data.
- Append data to event data.
Predicates
Predicates are a set of logical rules that are used to evaluate events when they are processed. This enables the Extended Events user to selectively capture event data based on specific criteria.
Predicates are evaluated as full Boolean expressions, and support short circuiting at the first point where the entire expression is found to be false.
Predicates can store data in a local context that can be used for creating predicates that return true once every n minutes or every n times that an event fires.
Types
Because data is a collection of bytes strung together, the length and characteristics of the byte collection are required in order to interpret the data. This information is encapsulated in the Type object. The following types are provided for package objects:
- event
- action
- target
- pred_source
- pred_compare
- type
We can use the following to look at the type available :
SELECT object_type, count(*) total
FROM sys.dm_xe_objects
GROUP BY object_type
Maps
A map table maps an internal value to a string, which enables a user to know what the value represents. Instead of only being able to obtain a numeric value, a user can get a meaningful description of the internal value. The following query shows how to obtain map values.
SELECT map_key, map_value, name
FROM sys.dm_xe_map_values
Demo Creating a Session
- Connect with SSMS.
- In the Object Explorer, click Management > Extended Events > New Session. The New Session dialog is preferable to the New Session Wizard, although the two are similar to each other.
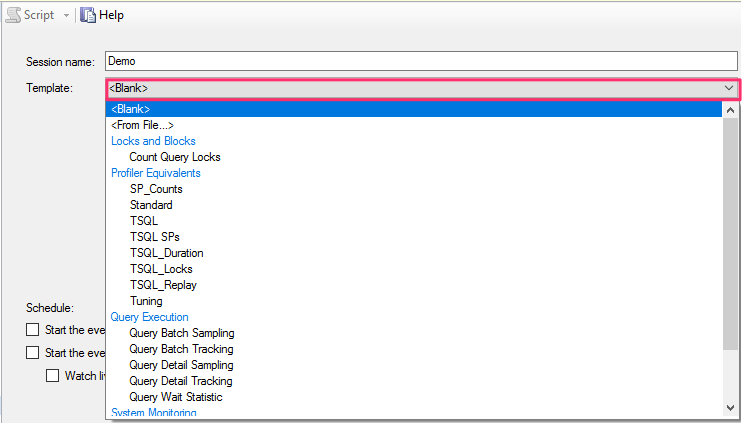
In the upper-left, click the General page. Then type Demo, or any name you like, into the Session name text box. Do not press the OK button yet, that comes only at the end of the demo.
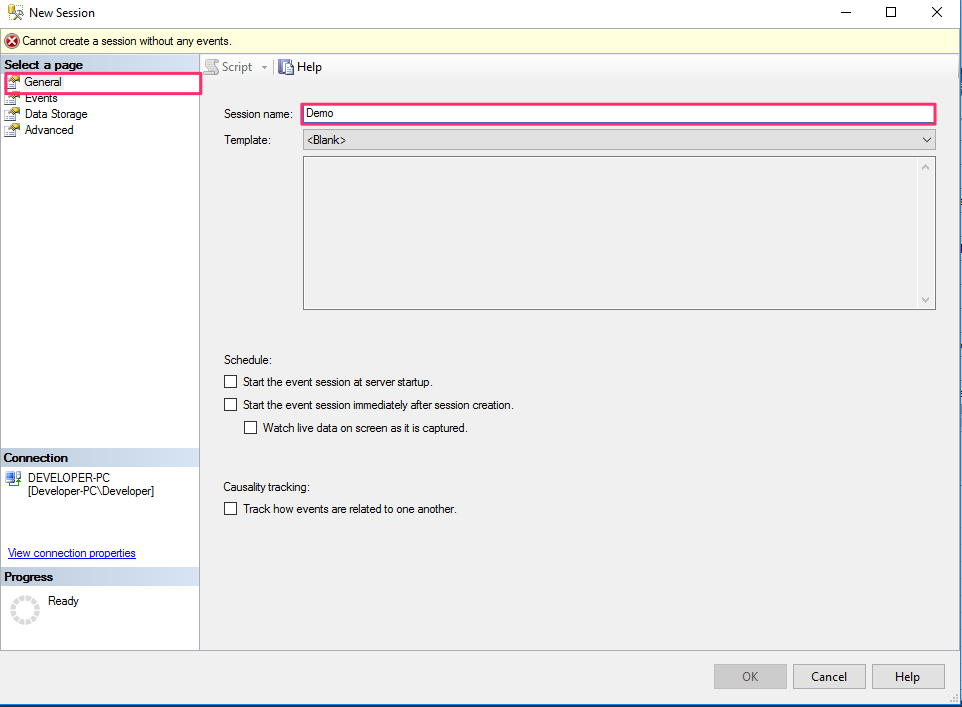
You can choose some predefined session here using the template, but in this section we will choose the events manually.
Using the wizard we can create a session to gather performance data. Here are the available templates :
Query Batch Sampling - This template will capture queries and procedure calls for 20 percent of all active sessions on the server.
Query Batch Tracking - This template captures all queries and procedures for all sessions on the server.
Query Detail Sampling - This template contains a set of events that will capture every statement in queries and procedures for 20 percent of all active sessions on the server.
Query Detail Tracking - This template is the same as Query Batch Tracking, but for every single statement in the system as well. This generates a large amount of data.
Query Wait Statistic - This template captures wait statistics for each statement of every query and procedure for 20 percent of all active sessions.
In the upper-left, click the Events page, and then click the Select button.
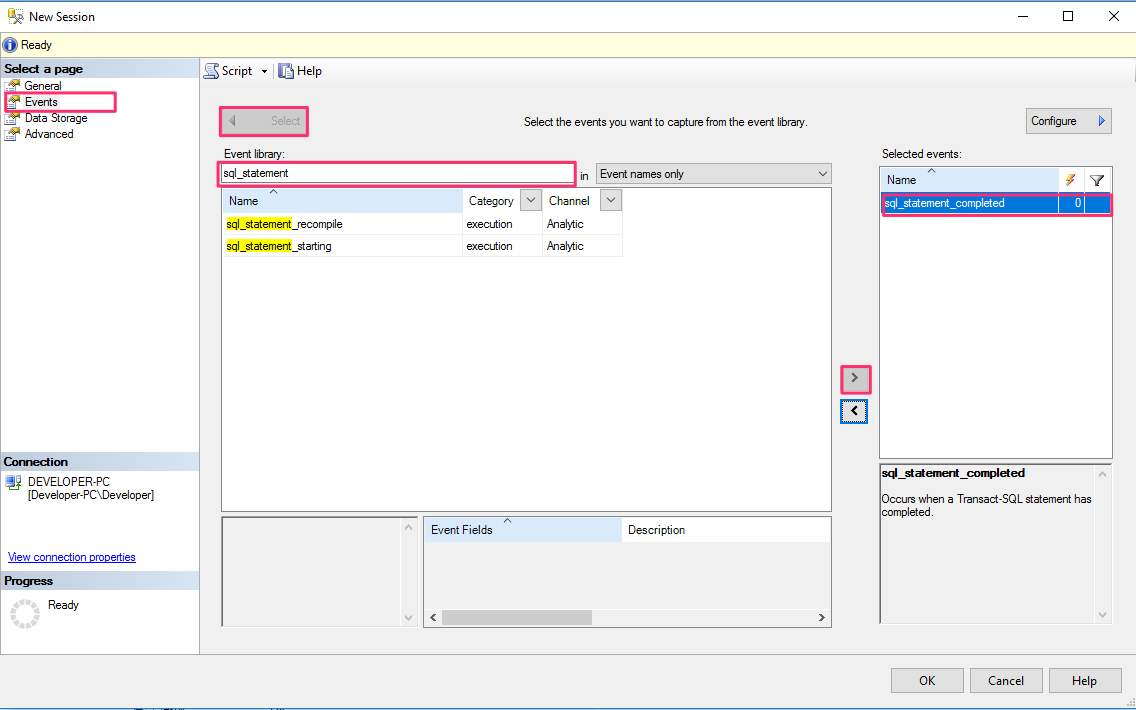
In the Event library area, in the drop-down list, choose Event names only.
- Into the text box, type in sql, which filters and reduces the long list of available events by using a contains operator.
- Scroll and click the event named sql_statement_completed.
- Click the right arrow button > to move the event to the Selected events box.
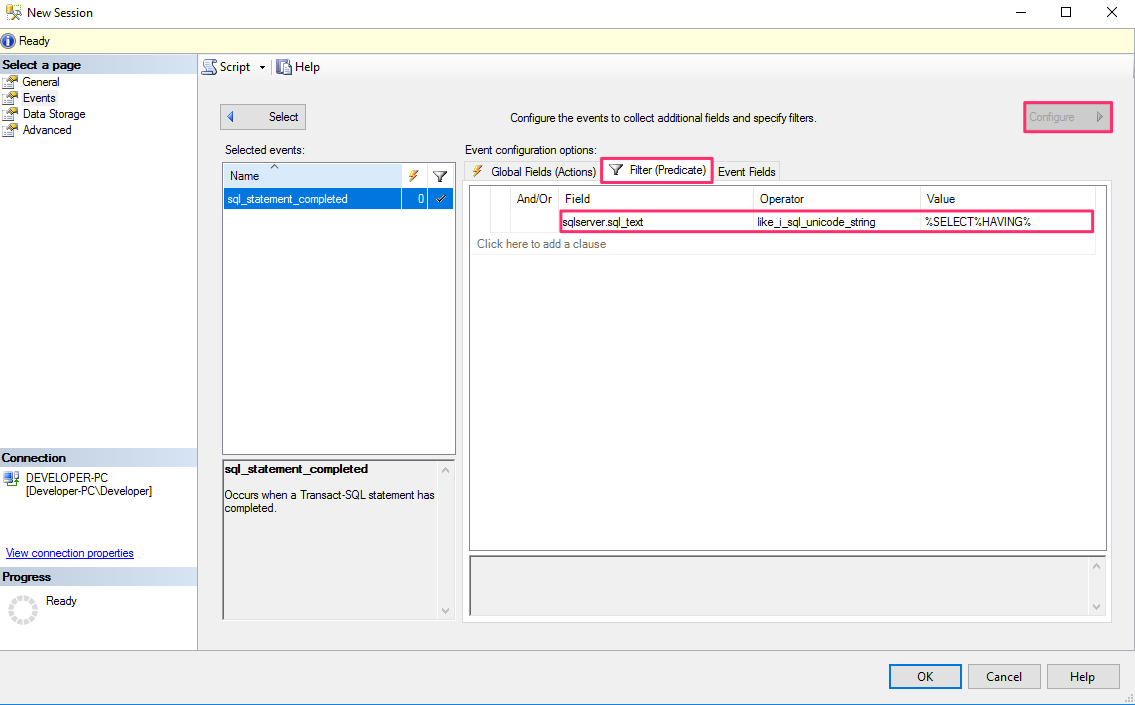
Staying on the Events page, click the Configure button at the far right.
- With the left side chopped off for better display, in the following screenshot you can see the Event configuration options area.
Click the Filter (Predicate) tab. Next, click Click here to add a clause, for the intention of capturing all SQL SELECT statements that have a HAVING clause.
In the Field drop-down list, and choose sqlserver.sql_text.
- For Operator choose a LIKE operator.
- For Value type in %SELECT%HAVING%
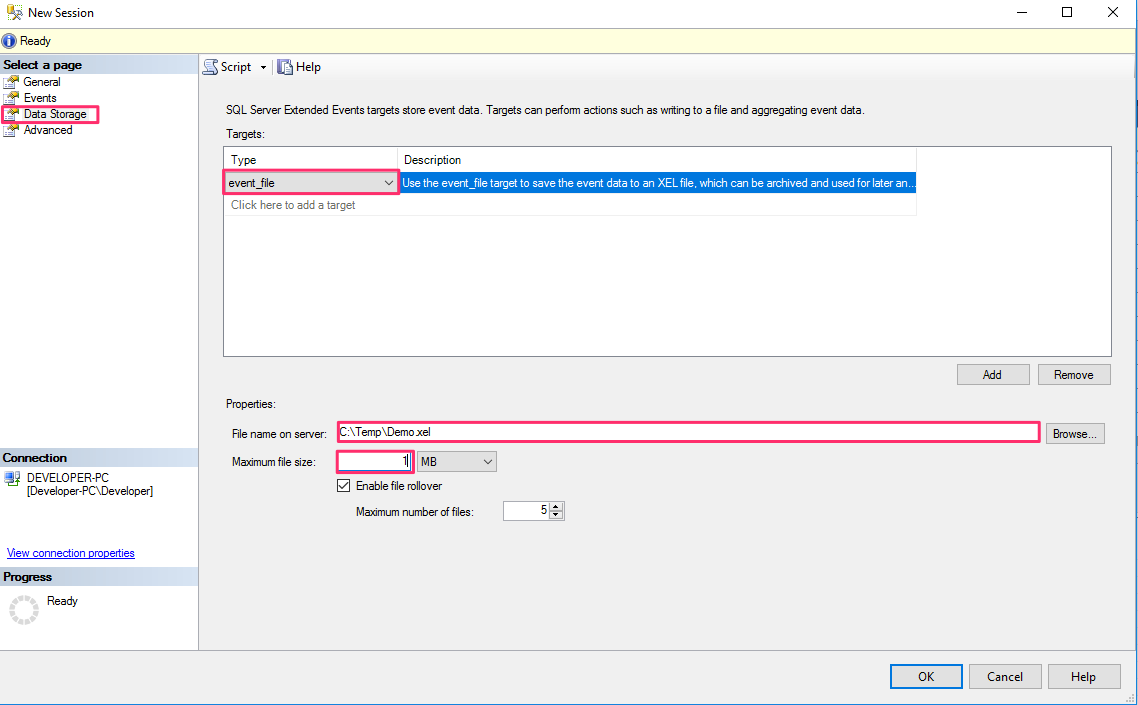
In the upper-left, click the Data Storage page.
In the Targets area, click Click here to a target.
- In the Type drop-down list, choose event_file.
- This means the event data will be stored in a file that we can view.
In the Properties area, type in a full path and file name into the File name on server text box.
- The file name extension must be .xel.
- Our little test will need less than 1 MB of file size.
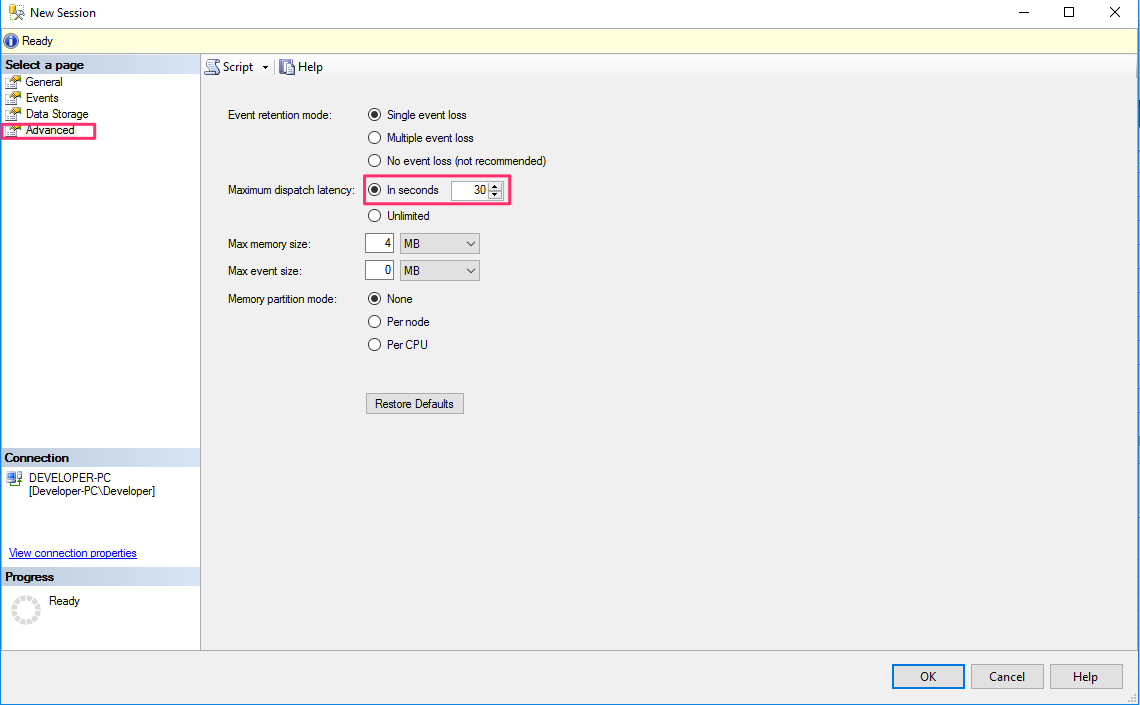
In the upper-left, click the Advanced page. Leave the Maximum dispatch latency at 30 seconds. Finally, click the OK button at the bottom.
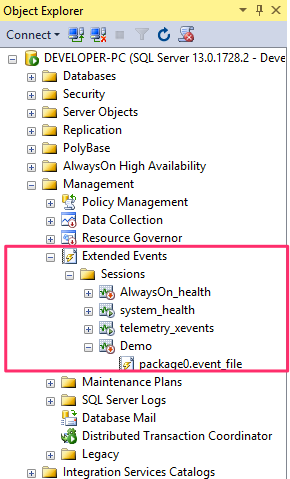
Back in the Object Explorer, expand Management > Sessions, and see the new node for Demo.
Extended Events Automation
You can script the Extended Events Session from within the wizard. This script can then be applied on other server to gather the same metrics.
Scripting the Session
- Define a session.
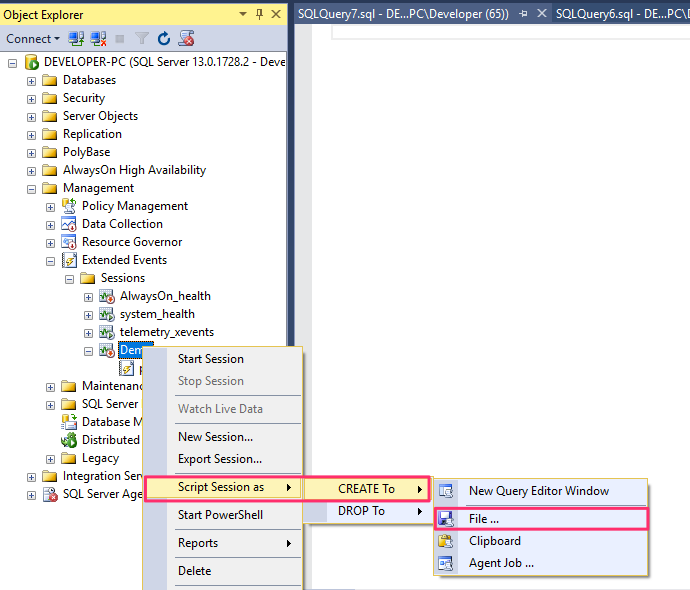
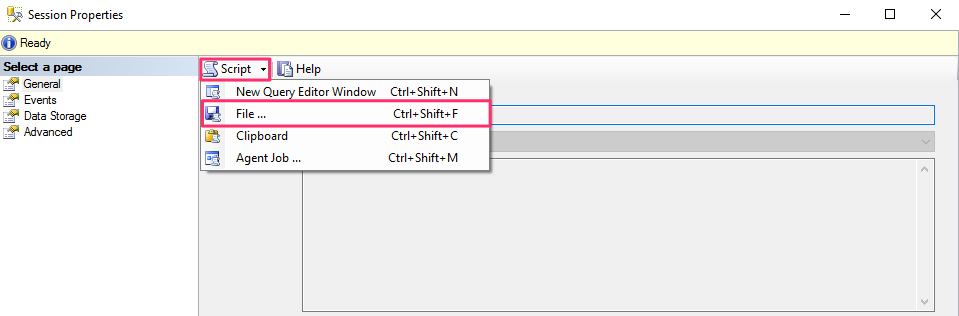
- Right-click the Demo session, and select Script Sessions As > CREATE To > File to output straight to a file. Or, use the Script button at the top of the New Session window to create a T-SQL command in the Query window.
- These steps will generate the script that you need to create a session and output it to a file.
To manually create this new trace, use Management Studio as follows:
- Open the script file or navigate to the Query window.
- Modify the path and file location for the server you’re creating this session on.
- Execute the script.
Here is the SQL script of the session :
CREATE EVENT SESSION [Demo] ON SERVER
ADD EVENT sqlserver.sql_statement_completed(
    WHERE ([sqlserver].[like_i_sql_unicode_string]([sqlserver].[sql_text],N'%SELECT%HAVING%')))
ADD TARGET package0.event_file(SET filename=N'C:\Temp\Demo.xel',max_file_size=(10))
WITH (MAX_MEMORY=4096 KB,
		EVENT_RETENTION_MODE=ALLOW_SINGLE_EVENT_LOSS,
		MAX_DISPATCH_LATENCY=30 SECONDS,MAX_EVENT_SIZE=0 KB,
		MEMORY_PARTITION_MODE=NONE,
		TRACK_CAUSALITY=OFF,
		STARTUP_STATE=OFF)
GO
Once the session is created, you can use the following command to start it:
ALTER EVENT SESSION [Demo]
ON SERVER
STATE = START;
Testing the Session with Data
Test your event session with these simple steps:
- In the SSMS Object Explorer, right-click Demo session node, and then click Start Session.
Run the following SELECT…HAVING statement a couple times.
- Ideally you might change the HAVING Count value between the two runs, toggling between 2 and 3. This enables you to see the differences in the results.
    SELECT
        c.name,
        Count(*)  AS [Count-Per-Column-Repeated-Name]
    FROM
            sys.syscolumns  AS c
        JOIN sys.sysobjects  AS o

            ON o.id = c.id
    WHERE
        o.type = 'V'
        AND
        c.name like '%event%'
    GROUP BY
        c.name
    HAVING
        Count(*) >= 3   --2     -- Try both values during session.
    ORDER BY
        c.name;
Right-click your session node, and then click Stop Session.
Displaying Results
You can view the results in two ways :
- View target data
- Watch live data
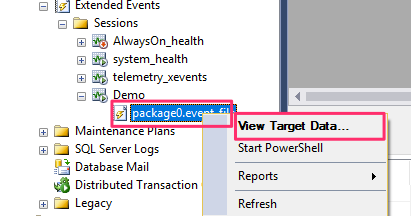
View Target Data
In the SSMS Object Explorer, you can right-click the target node which is under your event session node. In the context menu you click View Target Data. SSMS displays the data. The display is not updated as new data is reported by the event. But you can click View Target Data again.
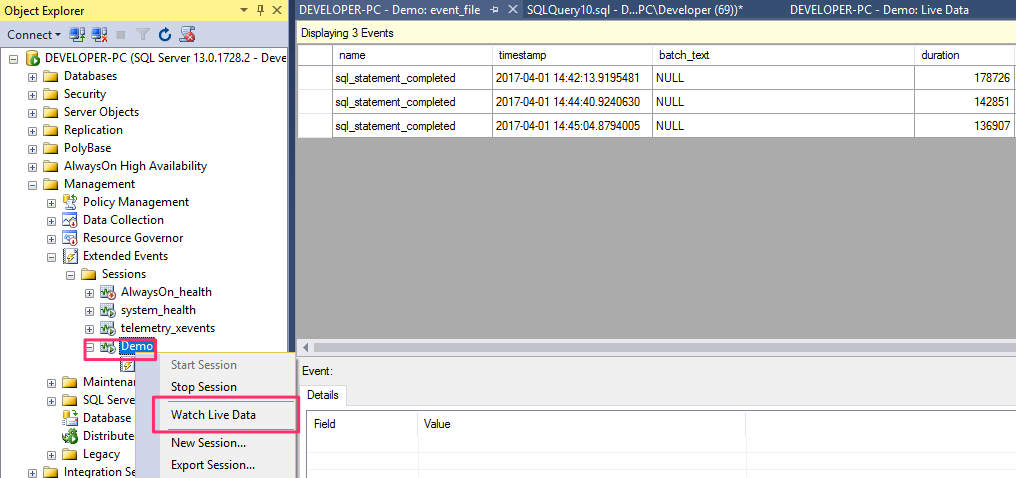
Watch Live Data
n the SSMS Object Explorer, you can right-click your Demo session node. In the context menu you click Watch Live Data. SSMS displays incoming data as it continues to arrive in real time.