Query Execution
Reading Query Plans
SQL Server supports displaying the query plans as :
- Graphical
- Text
- XML
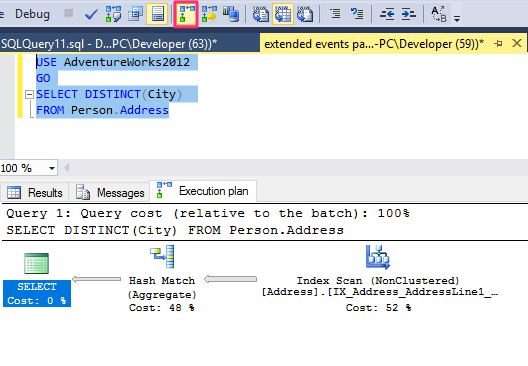
Display Graphical Query Plan
Using SQL Server Management Studio we can display two types of the execution plan :
- Estimated Execution Plan
- Actual Execution Plan
SQL Server Join Operators
- Hash joins
- Merge joins
- Nested loop joins
Hash Join
Let’s use the following query to look at the Hash Join :
USE AdventureWorks2012
GO
SELECT  p.*
FROM  Production.Product p
JOIN Production.ProductCategory pc
ON p.ProductSubcategoryID = pc.ProductCategoryID;
The query above will produce the following query plan :
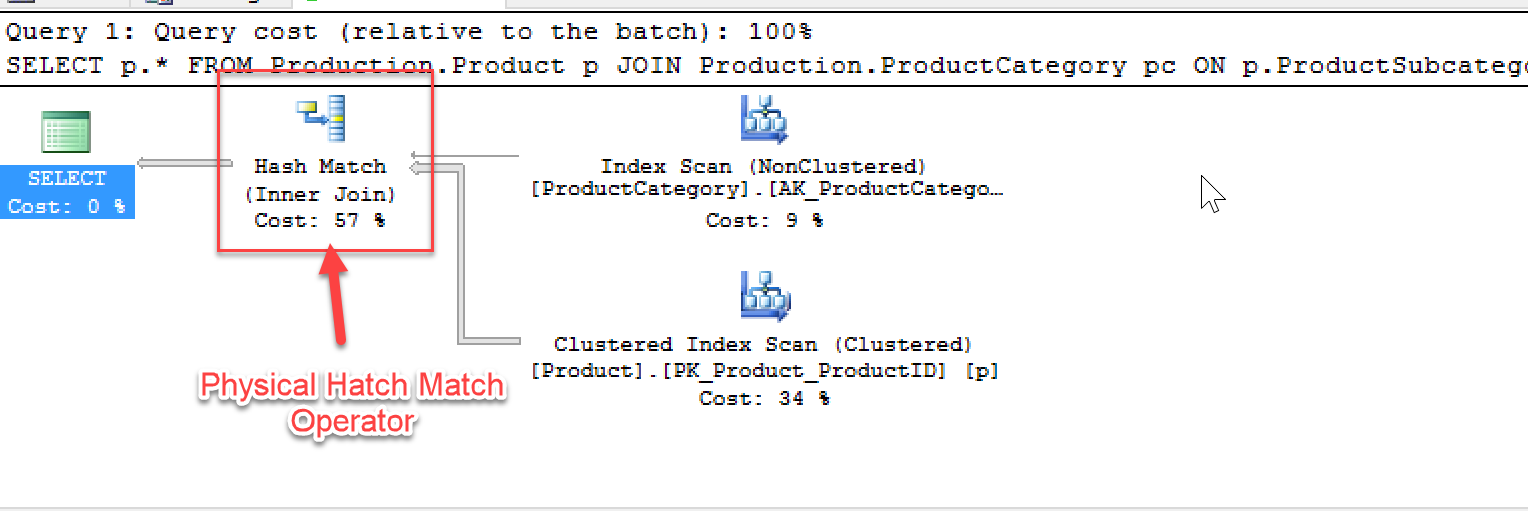
The query optimizer uses hash joins to process large, unsorted, nonindexed inputs efficiently.
Merge Join
n the previous case, input from the Product table is larger, and the table is not indexed on the joining column (ProductCategorylD). Using the following simple query, you can see different behavior:
SELECT  pm.*
FROM    Production.ProductModel pm
JOIN    Production.ProductModelProductDescriptionCulture pmpd
ON pm.ProductModelID = pmpd.ProductModelID ;
Characteristics :
- The optimizer chooses for medium workloads
- Requires sorted inputs
- Can use an index to provide sorted inputs
- Reads the inputs only once
Nested Loop Join
The optimizer uses the Nested Join for workloads with a small resultset. Lets us the following query and see the query plan :
SELECT  pm.*
FROM    Production.ProductModel pm
JOIN    Production.ProductModelProductDescriptionCulture pmpd
ON pm.ProductModelID = pmpd.ProductModelID
WHERE pm.Name = 'HL Mountain Front Wheel';
Characteristics
- Smaller results
- The inner table is executed as many times as the row of the outer table
Query Resource Cost
Even though the execution plan for a query provides a detailed processing strategy and the estimated relative costs of the individual steps involved, it doesn’t provide the actual cost of the query in terms of CPU usage, reads/writes to disk, or query duration. You will need to do optimization to reduce the cost of the queires.
Query Plans
SQL Server breaks an SQL query into blocks called iterators. Each iterator represents a single function or operation. It then uses these iterators to build a query tree known as an execution plan. A single statement can produce different execution plans. The SQL Server optimizer is responsible for costing the least expensive query plan for execution.
sys.dm_exec_requests and sys.dm_exec_sessions
sys.dm_exec_requests- displays the requests currently executing on SQL Serversys.dm_exec_sessions- shows the authenticated sessions on the instance.
Open a new query window and record your session id and replace it in the query :
DBCC FREEPROCCACHE
DBCC DROPCLEANBUFFERS
GO
SELECT cpu_time, reads, total_elapsed_time, logical_reads, row_count
FROM sys.dm_exec_requests
WHERE session_id = <session id>
GO
SELECT cpu_time, reads, total_elapsed_time, logical_reads, row_count
FROM sys.dm_exec_sessions
WHERE session_id = <session id>
and in another window run some queries and as you run, run the queries with the dmvs and observe. You will notice that the query stats are only available for the sys.dm_exec_requests only whilst the query is running. The values in sys.dm_exec_sessions keeps accumulating since they record for the session.